#VCOM Tomorrow - The Future of Alarming and PV Monitoring
Probably these are the most exciting and fascinating questions I am asked in my daily business as a product manager. This pushes us to not only look one step ahead for a better product but also to continuously reshape the product itself for a better user experience. And to find the right answers to these topics it is essential to go a bit backward. Does this seem contradictory? Not at all. As a core part of any monitoring software, an efficient alarming system should always meet the needs of the O&M Manager in a world shaken by never-ending changes. And then it is obvious to see that what matters today is the following: identify the most important/critical losses within an asset and recognize, in a simple way, its faulty components.
For this purpose, we decided to take advantage of one of our biggest strengths: data, lots of data. As an O&M software provider, we can collect data from any source thanks to our open import interface. The newest data management and machine learning technologies allow us today to learn what is the normal behavior of an inverter as a main component of a pv system, which leads then to learn the behavior of the system itself. With this approach, we aim to intelligently detect possible losses and handle the source of errors quickly and easily.
What does this actually mean for VCOM today? Let's have a look at the following use case.
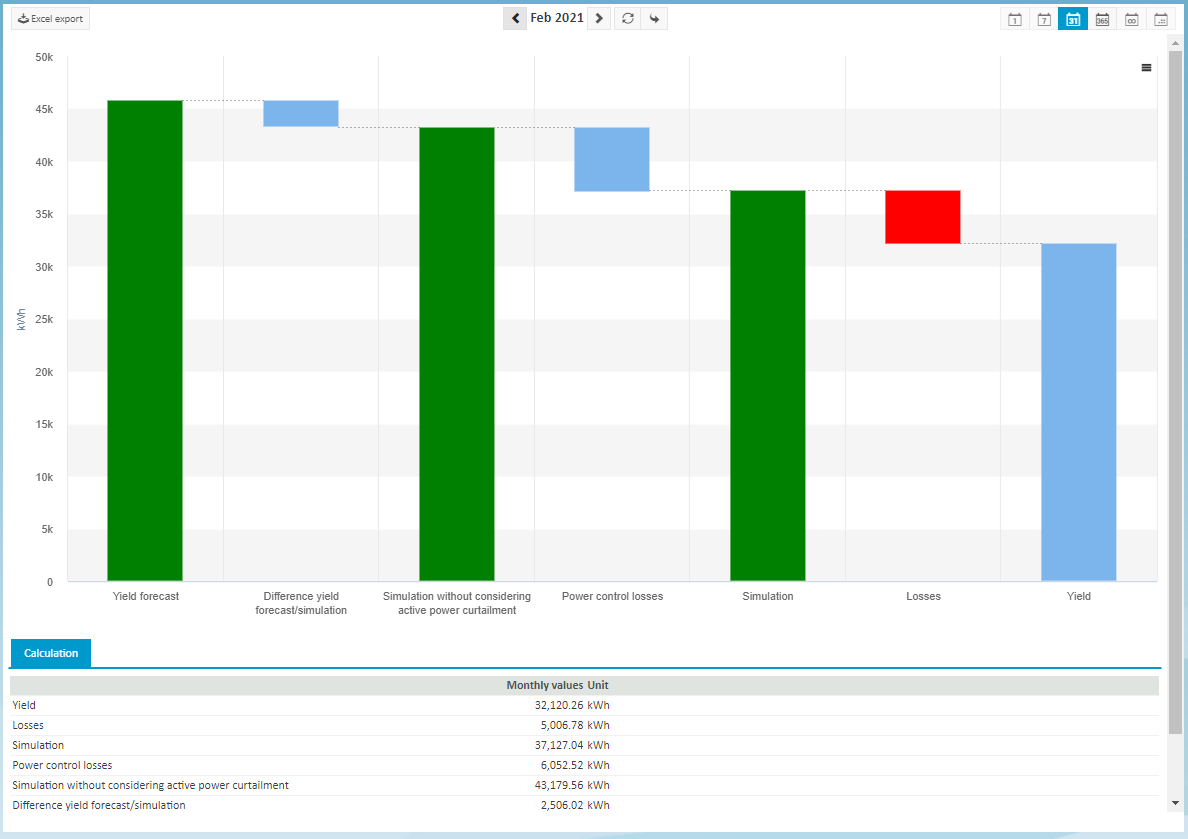
While managing a whole asset it is important to pick out the following information: Is my asset working well so far? Where am I losing energy at most and how can I identify the associated failures? The loss breakdown chart is the right tool to start getting a handle on this: from the yield forecast to the actual energy production of a pv system, the losses are displayed based on our simulation. In addition to the graphical representation of the losses on the chart, ticket-related information is listed in tabular form according to the cause of the error. This allows you to quickly and intuitively identify any failure causes of your assets and thus maintain your asset efficiently.
A big advantage to using our hardware: For plants equipped with blue'Logs, which are controlled by the grid operator or the direct marketer, or which conditionally operate in a zero-feed-in mode, the simulation is now carried out in two iterations, so that the losses caused by power control are displayed simply and intuitively.

But what about the losses between the simulation and the yield? How can I interpret them and can I decide whether it is something urgent or not?
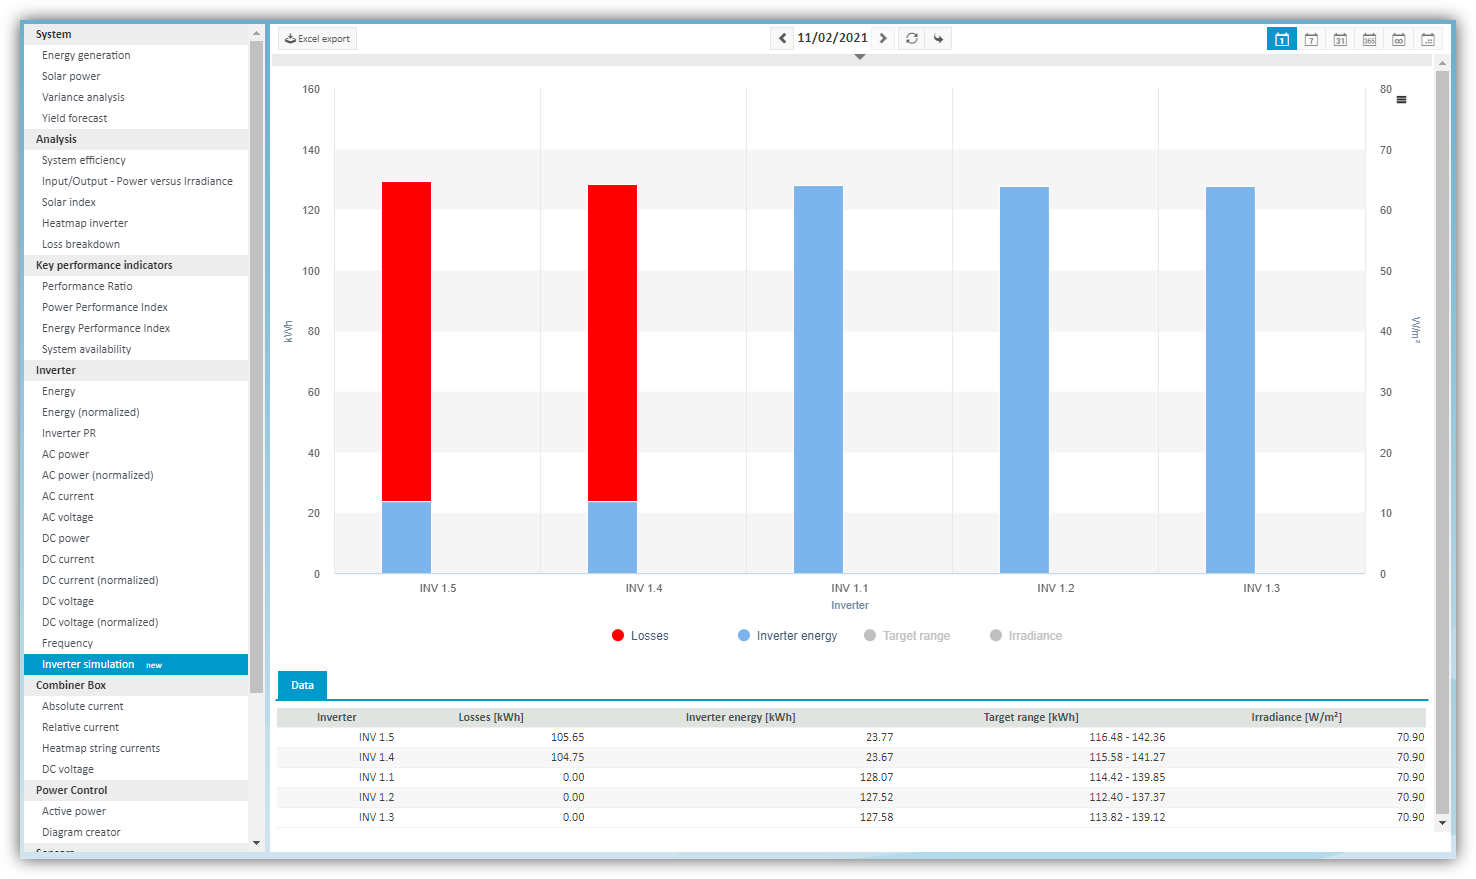
The simulation algorithm is applied to all inverters and is based on live sensor irradiance data. The technical data of each inverter, as well as the historically measured data of each device, are considered for the theoretically expected yield, which is optimized by our machine learning algorithms in order to achieve the most accurate results possible. The estimated losses between the simulation results and the measured yield are displayed on the chart to give an overview of the inverter performance of your system on a daily basis. No wonder we can identify on the chart below for the inverter simulation two inverters with considerable losses in this use case:

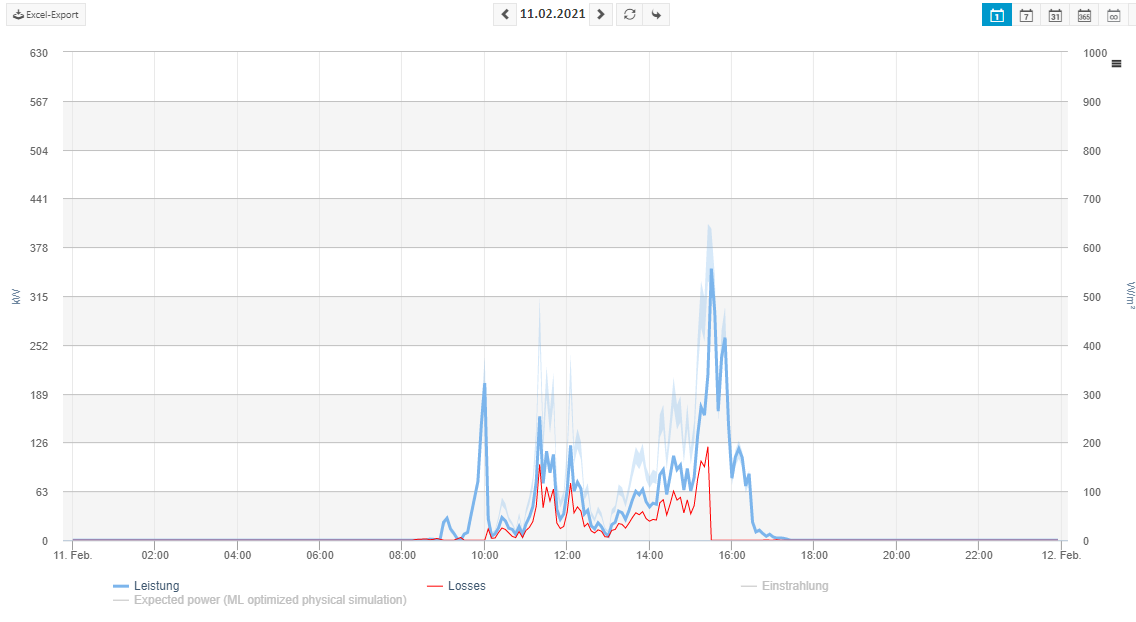
It is evident this has a direct effect on the system behavior, as we can see on the following solar power chart on system level: an inverter outage or misproduction leads systematically to a misproduction on plant level. This information, its effect on the system, as well as its priority, must be provided in real-time and in a simple way to the O&M Manager. State-of-the-art machine learning algorithms are able to detect various sources of error, which must not lead to a false alarm, for example, yield reduction due to shading, dirty or skewed irradiance sensors, or inaccuracies in the temperature or irradiance data. In the end, our goal is not to merely optimize a chart, but our machine learning approach allows us to learn all the specific details by excluding systematic errors.

The worldwide continuous growth (yes, for once growth can be beneficial for our planet) in the pv industry makes it impossible to find the time for a deep technical calibration in order to use a reliable O&M process. In this sense, all the benefits of machine learning and all the benefits of the data we dispose of, lead to an efficient, modern monitoring system that only creates alarms that matter. This sounds great, but what about inverter events? Definitely crucial information, but this should be seen as a medium for the error cause recognition rather than a path to identify the error itself. Our component-based digital twin makes it possible to identify critical alarms and combine them with the respective device error code.
My personal purpose and motivation
With the goal of helping our customers in their digital transformation journey, a key part of my journey as a product manager at meteocontrol is to identify the why behind current problems and, together with our development team, use the right technologies for the right purposes. We always stay in a continuous and close exchange with our customers to maintain a full comprehension of the effects of our products and maintain a solid added value for the user.