#VCOM today - 7: KPIs - PR, Availability and EPI
A Wikipedia definition:
A key performance indicator (KPI) is a type of performance measurement. KPIs evaluate the success of an organization or of a particular activity (such as projects, programs, products and other initiatives) in which it engages.
Sounds pretty simple and I assume we all understand what this means and we have an example in mind where KPIs are used. But let's get back to how you feel about KPIs. This is typically much more interesting than a purely scientific definition. Our feelings tell us a lot about topics we have to deal with on a daily basis. Do KPIs lead to positive feelings? Or is it rather linked to negative feelings?
Regardless of your answer: Think about the reasons why and jot down some bullet points to remember your feelings later on.
Maybe you wonder what I personally think about KPIs. To be very honest, I am a fan. KPIs can, if they are calculated correctly, tell us a lot with only one number. We do not need to read pages of reports or study hard and interpret Excel tables. A single KPI can help me draw conclusions pretty quickly.
You have maybe noticed a part of the last sentences: "If they are calculated correctly". And this is key for me when describing KPIs. I like to compare KPIs to statistics. You have maybe heard the expression: Don't trust any statistics that you haven't faked yourself. With KPIs it is similar. Lots of information is and has to be compressed into one single number. This can be dangerous, if the KPIs are not defined clearly and reproducibly.
To put it in a nutshell: I love KPIs, if they are well-defined and easy to calculate.
What about solar PV and KPIs? KPIs have gotten more and more important over the last years. KPIs like the Performance Ratio (PR) or the Availability have been defined and it is more or less market standard to use these KPIs in order to benchmark PV plants and their performance. It depends a bit, on which chair we sit. Are we an investor, are we an EPC or are we the O&M? We may all think a bit differently about KPIs and our interests in the result of the KPI may defer. But I think we can state, that KPIs help us to communicate with each other with "a common language" - the language of KPIs.
Important: Make sure that you really speak a common language and that you do not have different dialects!
In order to avoid speaking different dialects, meaning defining KPIs differently, you need to speak with each other. For example: If an investor asks the O&M for an availability or even PR guarantee, it is more than important that both have exactly the same understanding of how the KPI is calculated. As soon as this is defined properly, we can start using the KPIs in daily life. And then, from my personal experience, KPIs really help to improve the communication between the investor and the O&M, because things are clearly defined and therefore easy to interpret. See it as a chance and use KPIs as a tool for better communication.
KPIs in the VCOM
Lets sum up, what we have learned:
- KPIs need to be defined clearly
- The calculation of KPIs has to be easy and reproducible
The VCOM allows us to calculate various KPIs. E.g. the PR, the Availability and the Energy Performance Index (EPI). It is highly important, that you don't start calculating KPIs at the end of the month or year manually, just because the definition of the PR for you is different from the definition of the PR in your monitoring tool. VCOM provides you various possibilities to edit the way the KPIs are calculated. You are able, plant-specifically, to define the way the KPI calculation works and what data has to be taken into account.
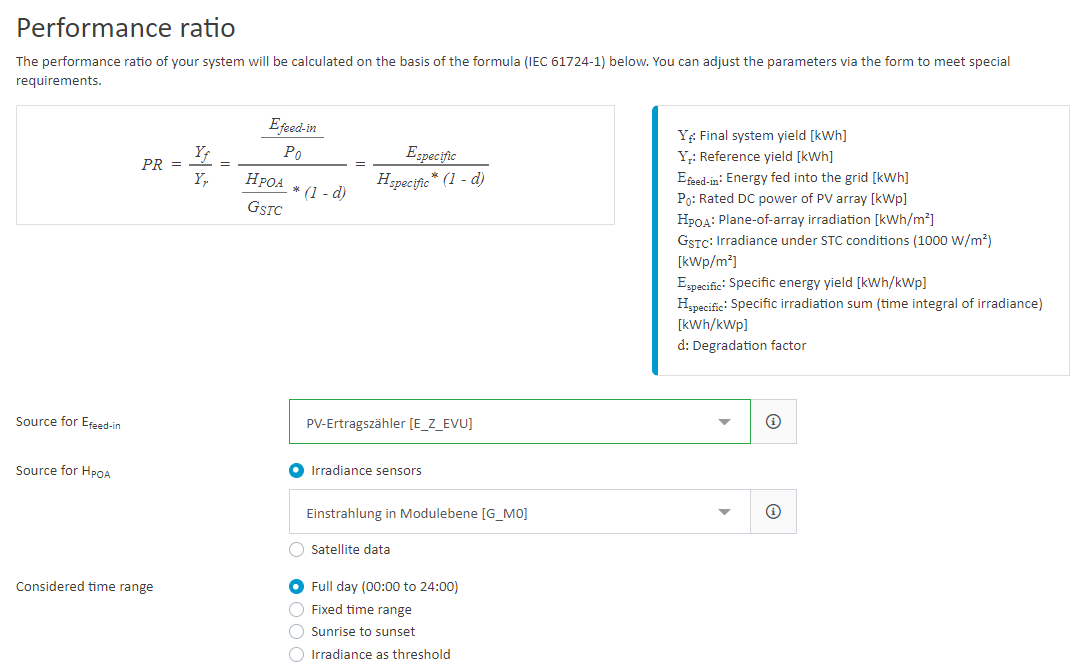
The PR calculation as an example.

Picture: PR Editor
As you can see above, the scientific and basic formula of the PR calculation is always the same. The definition of the input parameters makes the difference.
First, you have to define the sources for the energy production and irradiance. Side note: Only with pyranometers (or satellite data), do you get reliable and comparable results. Pyranometers measure the global irradiance, like satellite data does. Therefore the results of the PR calculation in the operational phase can be compared to the PR calculated in yield reports. Due to the technology of silicon irradiance sensors, the PR calculation based on this sensor type is not comparable to calculated expected PRs of yield studies.
In the next step you are able to define a time range for the calculation. I personally prefer to use the "sunrise to sunset" or "irradiance by threshold" mode. Both methods exclude time ranges without any relevant effect on the real PR.
If you want, or if your are allowed to, you can exclude further time ranges, that should not be taken into account. When does this make sense? One example: When the grid has a shut down, are you as the O&M responsible? I would say: No. So wouldn't it be fair to exclude time ranges when the grid was shut down from the calculation? You can do this with the field "Excluded ticket causes". As soon as you declare a ticket with the root cause "grid failure", then the related time ranges will automatically be excluded in the calculation.
Finally you can choose the aggregation model, and that's it.
With these settings you will receive reliable PR results - based on the definition of the PR in your contracts and without any further manual calculation in Excel.
And if you want to dive even deeper: Feel free to check the settings in Temperature Compensation, Degradation and Power Control Effects.
The Availability and the Energy Performance Index (EPI) are two further KPIs, that are frequently used in solar PV.
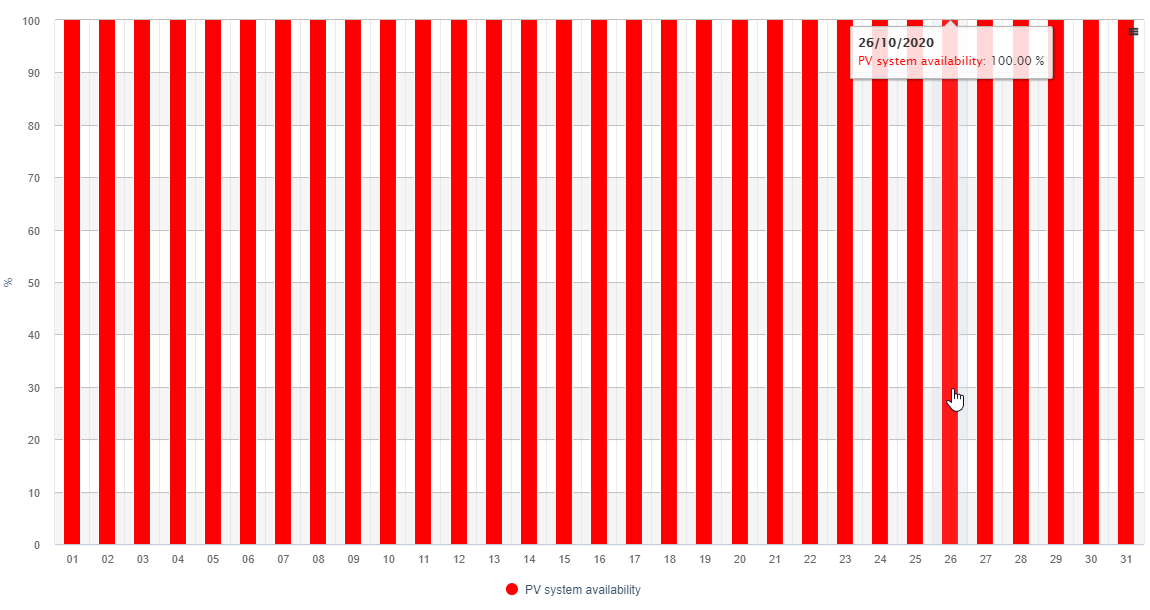
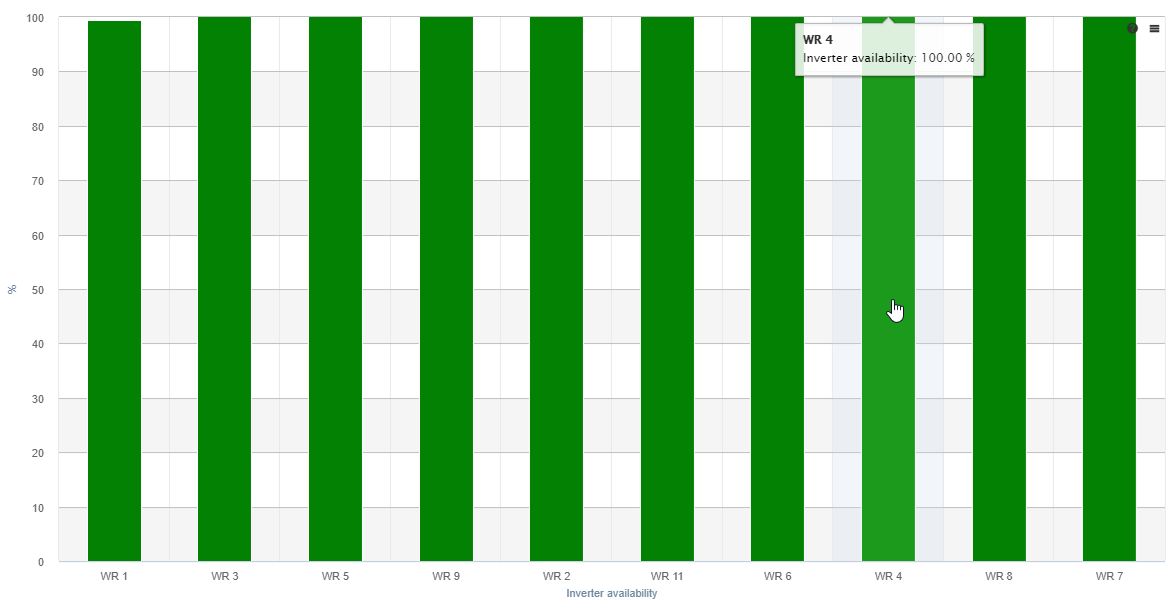
The time-based system Availability is available for the overall plant and on the inverter level. Especially the Availability on plant level is a well-known KPI you can find in many O&M contracts.

Picture: System Availability, August 2020

Picture: Inverter Availability, August 2020
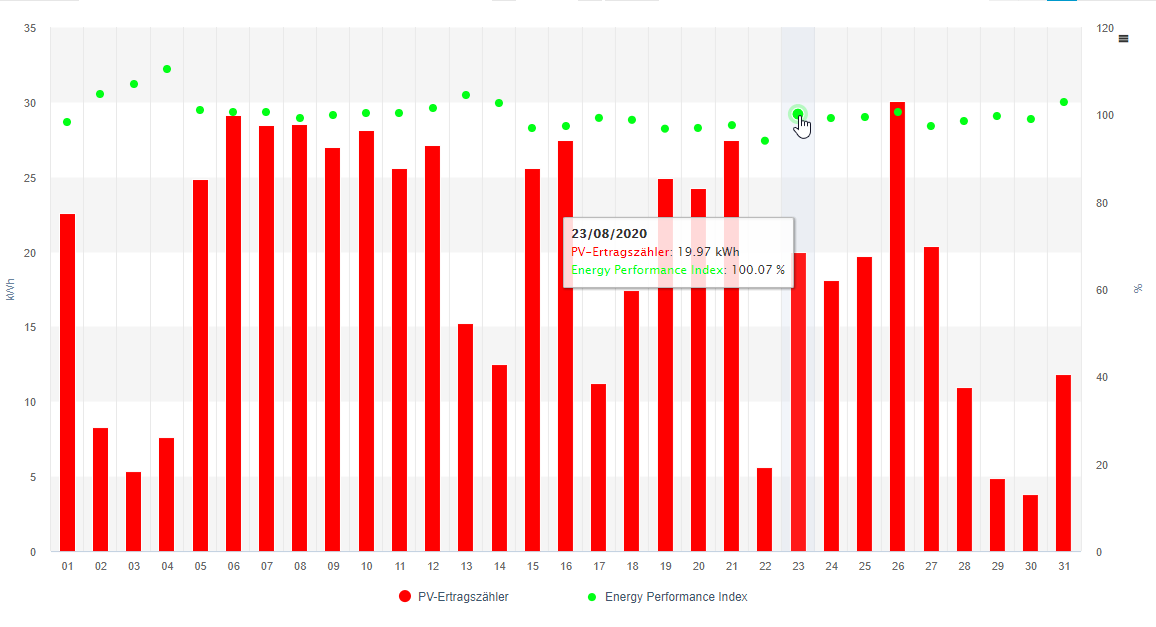
The Energy Performance Index is defined as the ratio between the specific yield and the simulated yield. The goal should be to be as close to 100% as possible. Easy and fast to interpret, isn't it? The green dots in the chart below show the EPI. In red, you can see the actual energy generation of the day.

Picture: EPI - Energy Performance Index
Although KPIs are sometimes a bit abstract, they all help us to understand the overall performance of PV projects as fast as possible. And if they are clearly defined they help us to improve the fact based communication between the different parties involved.
I know, that KPIs are a "special topic". Share your experiences - which KPIs do you typically use? Do you like them or not? And why? What could we improve when you think about the KPI calculation in the VCOM? Let me know - I am looking forward to your feedback!
#Nerdtalk: Data Quality
As you may experience, data quality is one of the hottest topics in solar PV monitoring.
Two tips:
- Data Input KPI in Performance Overview
One option to see if the connection between your monitoring hardware on site and the VCOM works properly, is to check the Data Input in the Performance Overview.
- blue'Log requests/answers evaluation if data should be incomplete
When you face communication problems in the communication network on site, you are able to use the blue'Log to check the communication quality between the single devices and the blue'Log.
The following chart shows, that:
Inverter 1: 148 requests have been sent out and 148 answers were received.
Inverter 2: 149 requests have been sent out and 149 answers were received.

Picture: Chart with telegrams transmitted and telegrams received
Both connections seem to work perfectly fine. If there would be a communication problem, you would be able to see it here.